Some of the recent industrial production data has pointed to a slowdown in the Irish economy. This is particularly true of the “traditional” sub-index in the data. Here are the annual changes in the volume of production in this sector since 2011.
Annual growth rates have declined from around 10 per cent in late-2014/early 2015 to showing contraction in the most recently available data.
The “traditional” sector is simply the residual of the sectors that are included in the “modern” sector. Sectors are included in the modern sector if 85 per cent or more of the turnover in that sector is generated by foreign-owned companies. The sectors in the modern sector are:
- NACE 20: Chemical products
- NACE 21: Basic Pharmaceutical products and preparation
- NACE 26: Computer, electronic and optical equipment
- NACE 27: Electrical equipment
- NACE 18.20: Reproduction of recorded media
- NACE 32.50: Medical and dental instruments and supplies
Under the current weightings these sectors comprise around 60 per cent of the overall index so the remaining sectors which give us the “traditional” sector make up the other 40 per cent.
The main sectors of the traditional sector are:
- NACE 10: Manufacture of food products (0.65)
- NACE 11: Beverages (0.28)
- NACE 24-25: Basic metals and fabricated metal products (0.54)
- NACE 28: Machinery and equipment, not elsewhere classified (0.41)
- NACE 35: Electricity, gas, steam and air conditioning supply (0.33)
Between them, these categories make up around three-quarters of the “traditional” sector so whatever if driving the pattern in the chart above show be identifiable in one or more of these categories.
The numbers in the brackets give the correlations between the annual growth rates for these categories and the annual growth rates of the “traditional” sector. The two that probably stand out are those for food products and basic metals and the weighting for food products is about ten times greater than that for basic metals.
The growth rates for each of the five sectors can be seen here but just taking the first category above, i.e. the manufacture of food, gives the following:
And this, it seems likely, is where the pattern for the overall “traditional” sector comes from. As the manufacture of food products makes up about one-third of the “traditional” sector, naturally the swings in this category are larger than for the overall sector. The change in the growth rates is from annual growth of 20 per cent in early 2015 to negative growth approaching minus 10 per cent in the most recent data.
The data break go further and break the food sector into the following sub-categories:
- NACE 101: Meat and meat products (0.52)
- NACE 105: Dairy products (0.10)
- NACE 107: Bakery and farinaceous products (0.60)
- NACE 106,109: Grain mill and starch products; Prepared animal feeds (0.29)
- NACE 102-104, 108: Other food products (0.92)
All the annual growth rates are shown here but it is pretty obvious (from the correlations which are again shown in brackets) which category to focus on. That is ‘Other Food Products’ which by weighting makes up about three-quarters of the manufacture of food category.
This could be fish (NACE 102), fruit and vegetables (NACE 103) or oils and fats (NACE 104) but we are probably looking at something in the broad other category (NACE 108). With retail sales for food not showing anything like the volatility described above we should probably turn to the export data to see where these patterns are reflected. But nothing in the food export data (commodities categories 00 to 09) fits what we have seen here.
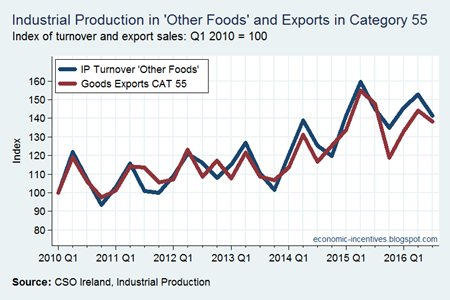
However, there is another export category that seems to fit the bill. Here is the quarterly industrial production turnover index for Other Food with a quarterly index of exports for commodity category 55.
I think we found a match. The output from “Other Foods” in the Industrial Production data is sold under Category 55 in the External Trade data. Category 55 is listed in the trade data as “Essential oils, perfume materials, toilet preparations etc.” which doesn’t seem to match.
If we look at the more detailed Trade Statistics releases we can see that Category 551: Essential Oil, Perfume and Flavour Materials is where most of the exports in Category 55 arise from with the bit “Flavour Materials” getting us back to something food related. Going a little further it can be seen that all the action is in Category 551.41: Mixtures of odoriferous substances for use in food/drink. In 2015, exports in Category 551.41 were €7.3 billion. The use of “odoriferous” suggests something that smells but it’s much more likely to be related to some form of concentrate. Total exports for Category 55 in 2015 were €8.0 billion so we can see that 551.41 provided over 90 per cent of those.
I’m not going to check the Trade Statistics release but item 551.41 seems to one of our most widely dispersed exports with country data provided for 56 countries. Exports for Jan-Oct for recent years are:
- 2013: €4,743 million
- 2014: €5,274 million
- 2015: €6,234 million
- 2016: €6,132 million
And we see strong growth in 2015 of near 20 per cent with a steep slowdown resulting in a contraction in 2016. Just as has been described as happening in Ireland’s “Traditional” manufacturing sector.
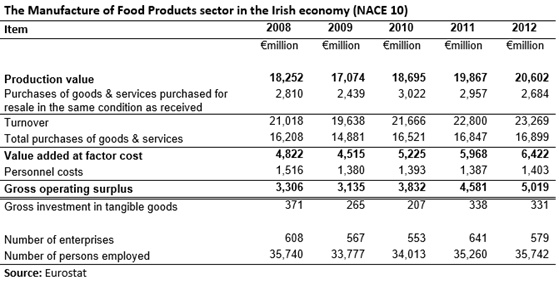
This suggests it is probably worth taking a broad look at the “food manufacturing” sector in Ireland. Here is some aggregate data for the sector.
Unfortunately, the data only go up to 2012 but by then we can see that we have an industry with an output of €20 billion from over 500 companies with 35,000 employees. [The data cover enterprises with 10 or more employees.] These companies generated a gross value added of nearly €6.5 billion,with around €1.5 billion going in pay to employees leaving a Gross Operating Surplus of €5 billion. Ireland’s food industry seems remarkably profitable.
However, the analysis of the industrial production and export data means that it is probably worthwhile to sub-divide the industry into domestically-owned and foreign-owned sectors. Here is the contribution of foreign-owned enterprises to Ireland’s food manufacturing industry.
We can see that almost half of the production arose in just 30 foreign-owned companies who have about 15 per cent of the persons employed in the industry. These are higher-paying companies as they contribute 25 per cent of the personnel costs of the industry with an average cost per employee of €62,500.
These companies generate around 70 per cent of the gross value added in the industry and earn about 85 per cent of the gross operating surplus (with a gross operating rate of over 35 per cent in 2012). It turns out the Irish food sector is so Irish after all. Inclusion in the “modern” sector as defined by the CSO requires 85 per cent of the turnover from a sector to come from foreign-owned firms. Although the manufacture of food products achieves this for gross operating surplus, the proportion of turnover generated by foreign-owned firms is around 50 per cent.
In 2012, exports in category 551.41 were €5.7 billion which is 60 per cent of the production value shown above. The manufacture of food products industry in Ireland is very concentrated.
For completeness, here is the contribution of domestically-owned enterprises to the Irish food manufacturing industry.
In contrast to the foreign-owned companies, domestically-owned companies had a gross operating rate of 7 per cent in 2012 (GOS as a per cent of turnover). The labour share of gross value added was almost 60 per cent though average personnel costs per person employed were €35,000 – almost 45 per cent lower than in foreign-owned companies in the sector.
What should we take from all this? Simply that Ireland’s “traditional” manufacturing sector may be subject to many of the same MNC effects we see in the “modern” sector so interpreting changes as reflective of the economy outside the MNCs may not be appropriate.
Tweet


No comments:
Post a Comment