Wednesday, August 29, 2012

Changes along the yield curve

The following image are screengrabs from Bloomberg for the yield on Irish government bonds over the past three months.  The top two are the 8-year and 5-year yields, while those across the bottom are the 3-year, 2-year and 1-year yields.  Click the image to enlarge.

Bond Yields 3M to 28-08-12

The actual bonds on which these indicative yields are derived can be seen in the NTMA’s Daily Outstanding Bonds Report.

There are two things worth noting.  First, is the continued upward-sloping yield curve for Irish government bonds.  The yields as calculated by Bloomberg go from 1.59% over one year to 5.90% over eight years.

Second, is the differing performance of the bonds over the past three months.  The longer term yields in the top row show a big shift in the aftermath of the EU summit of  at the end of June but show little change since then.  The eight-year has slowly edged below six percent but the five-year is largely where it was in the days after the summit.

On the other hand the shorter term yields of three years and under have all declined steadily over the past three months.  The three-year and two-year were declining in advance of the summit, experienced a small drop after it and have continued downward since.

Over the past three months the three-year yield (which is well outside the window of the current EU/IMF funding programme has gone from over seven percent to just under three and a half percent.  The two-year was also above seven percent but in just three months has now dropped to just two and a half percent.  The clear view is that the D-day bond due to mature in January 2014, which at one stage represented a funding cliff of around €12 billion, will be repaid. 

This January 2014 bond is now yielding around 2.2% is now trading at a price of around €102.40 per €100 unit (coupon 4.0%).  Last July, this bond briefly fell to as low as €65 per €100 unit.  That is a rise of nearly 60%.

The one-year yield has also declined recently but that is within the timeframe of the EU/IMF funding.   It might also be a factor that trading volumes over this period may be low but the NTMA report does show that there are trades occurring at these yields.

Tuesday, August 28, 2012

Retail Sales going nowhere

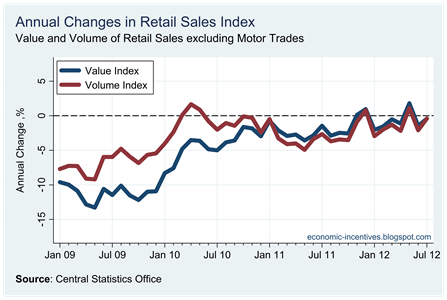
The release by the CSO of the provisional July figures for the Retail Sales Index continue to show a sector that is moribund.  Here is the retail sales index excluding the motor trades (which have a 21.6% weighting in the overall index for July).

Ex Motor Trades Index to July 2012

Monthly increases in the indices are not unusual; what is unusual a sequence of positive monthly increases.  During 2008 and 2009 the series fell precipitously.  This fall moderated during 2010 and the pattern since has been monthly fluctuations around a slightly falling trend-line.  The annual changes reflect this pattern.

Annual Change Ex Motor Trade Index to July 2012

Finally, here are the monthly changes in the series which highlight the inconsistency of the monthly changes.

Monthly Change Ex Motor Trade Index to July 2012

Friday, August 17, 2012

Eurozone sovereign bond ratings

Here is an update of a previous table with the addition of EZ ratings from Canadian firm DBRS (Dominion Bond Rating Service).  DBRS do not provide a rating for all EZ countries but their ratings can be important as shown below.

Bond Ratings(2)

This Bloomberg article from July 2011 explains how the ECB uses the ratings from these four companies.

The ECB determines the size of the premium, or so-called haircut, it applies to government bonds on the basis of the best credit rating from four companies -- Standard & Poor’s, Moody’s Investors Service, Fitch Ratings and DBRS. DBRS currently rates Ireland at A, two steps higher than the grades of S&P and Fitch and four steps above that of Moody’s.

DBRS’s rating means the ECB applies a 3 percent haircut on fixed-coupon Irish bonds with a residual maturity of five to seven years and a 4 percent premium on paper that will expire in seven to 10 years. Bonds rated BBB+ to BBB-, like those of Portugal, incur premiums of as much as 9 percent, as does debt from Greece, which is accepted as collateral independently of its rating.

Last week’s confirmation by DBRS of the A(low) rating for Ireland meant we ‘dodged a bullet’ in the words of this Wall Street Journal post

Canadian rating firm DBRS Inc. just showed the little guy still matters.  The fourth-biggest rating company downgraded Spanish and Italian government debt late Wednesday, and affirmed its stance on Irish bonds.

With the “big three” controlling around 95% of the global ratings market, DBRS doesn’t command the same attention. But when it comes to the euro-zone’s financially troubled countries, it should.

Because the European Central Bank listens to DBRS just as it does to the others.  DBRS is one of the four ratings firms the ECB uses when deciding how much it charges investors for using sovereign bonds as collateral in exchange for loans.

Luckily for those keen to avoid shakeouts in euro-zone bond markets, DBRS still rates those governments in the “A” category, with an “A (low)” for Spain and Ireland only one notch into the area. Italy is three notches above at an “A (high).”

Cutting them below an A-rating level would have spurred the ECB to charge 5% more for using Spanish and Irish government bonds as collateral.

DBRS have Italy at “A” rather than “A(high) as stated in the article.  Also the ECB’s collateral framework is set to be overhauled in September which may change the significance of these ratings.

Tuesday, August 14, 2012

Irish government bond yields

Bloomberg calculate a number of indicative yields for government bonds at different maturities.  For Ireland they currently provide 1-year, 2-year, 3-year, 5-year and 8-year yields.  The yield curve is upward sloping with the following yields (as of 15:45)

  • 1 year: 1.91%
  • 2 year: 2.74%
  • 3 year: 3.73%
  • 5 year: 5.38%
  • 8 year: 6.04%

Over the past month or so there has been a contrast in performance between those at the shorter end of the range (less than three years) and longer maturities.  This chart from Bloomberg compares the performance of the 2-year and 8-year yield relative to their positions 3 months ago.

Friday, August 10, 2012

Core Inflation Rises

Yesterday’s Consumer Price Index release for July from the CSO shows the overall rate of inflation falling for the fourth month in a row.  However, the source of inflation in Ireland is slowly beginning to shift.

July marked the since the start of 2010 that the overall inflation rate was equal to the ‘core’ inflation rate.  In this instance the core inflation rate is the 85% of the overall index that excludes energy products and mortgage interest.

Core Inflation July 2012

The overall index is being pulled down by reductions in mortgage interest (particularly for trackers with ECB rate now at 0.75% compared to 1.50% this time last year).  Excluding mortgage interest inflation is still running at 2.3%.  Since March the overall rate of inflation has fallen from 2.2% to 1.6%.  However there has been no significant drop excluding mortgage interest is just from 2.4% in March to 2.3% now.

Annual inflation is now being driven up by the following products (number in brackets is the expenditure weight in the CPI showing the importance of the price change):

  • Tobacco (2.6%) +6.5%
  • Private Rents (4.4%) +2.0%
  • Housing maintenance materials (0.3%) +3.9%
  • Non durable household goods (0.7%) +2.3%
  • Electricity (2.3%) +14.5%
  • Gas (1.2%) +18.1%
  • Health (4.6%) +0.7%
  • Motor fuel (6.1%) +6.3%
  • Motor tax (1.2%) +10.8%
  • Bus and taxi fares (1.0%) +6.4%
  • Air passenger transport (1.6%) +3.0%
  • Newspapers, books and stationery (1.5%) +1.7%
  • Package holidays (0.7%) +3.3%
  • Third-level education (1.6%) +13.5%
  • Licensed premises (6.5%) +1.7%
  • Health insurance (2.9%) +15.3%
  • Motor insurance(1.7%) +1.7%

There are numerous categories that have seen price declines as well and these are in the detailed sub-indices from the CPI.

Wednesday, August 8, 2012

Government Sector Financial Balance Sheet

The Central Bank have released their Quarterly Financial Accounts for Q1 2012 (release here; data here). This is the financial position of the government sector.

Government Balance Sheet Q1 2012

The currency assets of the government are the large cash reserves that have been maintained including more than €13 billion that was in the Exchequer Account.  The currency liabilities are mainly the state-savings schemes and deposits with An Post.

The assets under securities other than shares are mainly bonds held by the government sector.  The NTMA has some bonds in the discretionary portfolio of the NPRF and the state also holds €3 billion of subordinated bonds in the covered banks which forms part of their contingent capital.  The liabilities under this heading is almost entirely made up of the outstanding government bonds.

The €9 billion of loans held as assets will include loans forwarded by state agencies such as the Housing Finance Association.  The €80 billion of loan liabilities is primarily made up of €28.1 billion of promissory notes owed to the IBRC and €42.9 billion of loans drawn down as part of the EU/IMF programme.

The quoted shares will be the state’s shareholding in Bank of Ireland (15%), Allied Irish Bank (99.8%) and Irish Life & Permanent (99.4%) as well a 30% stake in Aer Lingus.  The unquoted shares represents the value of semi-state companies such as the ESB, Bord Gais, Coillte, Dublin Airport Authority and others.

The net financial position has €69.5 billion of financial assets partially offsetting €186.7 billion of financial liabilities giving an outcome of minus €117.2 billion.  The government sector’s net financial position improved from the start of the dataset in 2002 right through to the end of 2007 by which time the net position was negative €2.1 billion.  In the four years since the government sector’s financial position has deteriorated by €115 billion.

Thursday, August 2, 2012

Cork Independent 02/08/2012

The text of a short article from today’s Cork Independent is below the fold.  It offers some brief comments on the unemployment figures published recently as part of the results from Census 2011.  The newsprint version of the article can be seen on page 30 here alongside a rather colourful picture of some Naked Bike Riders!

Fitch on Mortgages

A report on the Irish mortgage market has attracted a lot of attention and in particular one projection contained in it.

These reports accurately reflect the press statement released by Fitch.  However, in an examination of the full report it is difficult to find the projection that 20% of mortgages (owner-occupied and buy-to-let) are expected to default.   Here is the first ‘key highlight’ on page 1:

Increased Foreclosure Frequency Expectations: The foreclosure Frequency (FF) assumptions for ‘Bsf’ and ‘AAsf’ rating categories have been adjusted upwards, due to worse-than-expected mortgage and house price performance. The ‘Bsf’ base FF for a standard mortgage portfolio has been increased to 10.0% from about 7.5%. The ‘AAsf’ base FF assumption is now 25%, up from 15% in the 2011 criteria.

To explain this a bit on page 6 we are told a bit more about the base foreclosure frequency expectations:

The expected FFs at the ‘Bsf‘ rating level, [.], reflect the default risk of an Irish residential mortgage loan with the following characteristics (‘standard loan‘):

    • loan is not in arrears;
    • full-time employed borrower with full income verification and no adverse credit history;
    • amortising loan paying monthly; and
    • loan purpose consisting of purchase/refinancing of the primary residence.

Thus, Fitch have increased their default expectation on what would be considered currently performing loans to 10%.  Fitch then adjust the foreclosure frequency from this base level of 10% based on the characteristics of the loan.  For example, loans with a poorer performance will be assigned higher default expectations.  The table on page 12 reflects this.

Foreclosure Frequency

The base category for performing loans is reflected in the 10% figure in the bottom left hand corner.  The increase in the default expectations can be seen by moving out along the row.  At the end of the row it can be seen that there is a default expectation of 70% for loans that are more than 3 months in arrears. 

The rows further up the table reflect different risk scenarios with the highest risk ‘AAsf’ scenario is “commensurate with a severe continued economic downturn” which includes a “peak-to-trough house price decline assumption is 72%”.  Fitch believes this and other assumptions are “sufficiently remote” for this high rating scenario.  In the ‘AAsf’ the base foreclosure frequency used is 2.5 times that in the ‘Bsf’ scenario, i.e 25%.  The intermediate risk scenarios have multiples of 1.1, 1.6 and 2.1 for their base foreclosure frequency on the ‘Bsf’ rate.

Fitch also make adjustments based on the original loan-to-value of the mortgage and a debt-to-income ratio based on an imputed monthly repayment and monthly net income of the borrower (at the time the loan was taken out).

Foreclosure Frequency2

For example, the foreclosure frequency for borrowers with an original loan-to-value of 75% and a monthly repayment which consumers between 30% and 40% of their net income is expected to be 8.1%.  The highest risk loans are clearly those with the highest original loan-to-values (now more than likely in significant negative equity) and the highest repayments relative to their income.

The imputed monthly repayment used to calculate the debt-to-income ratio could be a little high as the interest rate used is the “higher of 5.0% plus stabilised margin or the current Euribor rate plus stabilised margin”.  With about half of Irish mortgages on ECB tracker rates the current rates are far lower than the equilibrium rate used by Fitch. 

The ECB rate is not going to stay at the current lows but it will be some time before it is 5%+.  This won’t change the relative risk of borrowers and is primarily used to put the borrowers into different debt-to-income classes.  The default probabilities are also calculated using the base 10% foreclosure frequency as the starting point.

Fitch also make adjustments to the foreclosure frequency using a wide variety of other factors:

  • Self-employed with/without verified income
  • Prior bankruptcy or court judgement
  • Interest only loan
  • Payment holidays/restructured loans

Fitch don’t use an institution factor to distinguish between the banks.  Although all mortgages are relevant only those in the covered banks will have an impact on the government’s accounts.  The covered banks make up two-thirds of the Irish mortgage market and have a lower rate of arrears than the non-covered banks.

In last March’s stress tests carried out on the covered banks for the Central Bank, the base scenario used by BlackRock Consultants projected lifetime losses for the covered banks on the Irish mortgages of €9.7 billion.   This was a 10% loss on the €97.5 billion of losses that were on their books at the time of the stress tests.   Assuming a 50% recovery rate on defaulted mortgages this would be equivalent to a 20% foreclosure frequency.

The expected scenario of 20% mortgage defaults reported by Fitch yesterday is very similar to the base scenario used in the stress tests last March.  In fact, under the stress tests the banks were recapitalised to satisfy an adverse scenario with a 16.7% lifetime loss rate, implying a default rate of nearly 35% of the loan book, well in excess of the rate expected by Fitch.  As a result of last year’s recapitalisation the banks were covered for “three-year losses” under the adverse scenario and these were projected to be equivalent to 9.2% of the loan book.

The full document released by Fitch collates a lot of frequently used data on Irish mortgages and is an interesting read. We don’t get the details but it is clear that the headline 20% overall default rate for Irish mortgages is possible given the starting 10% default rate for ‘standard’ or performing loans in their expected scenario.

Printfriendly